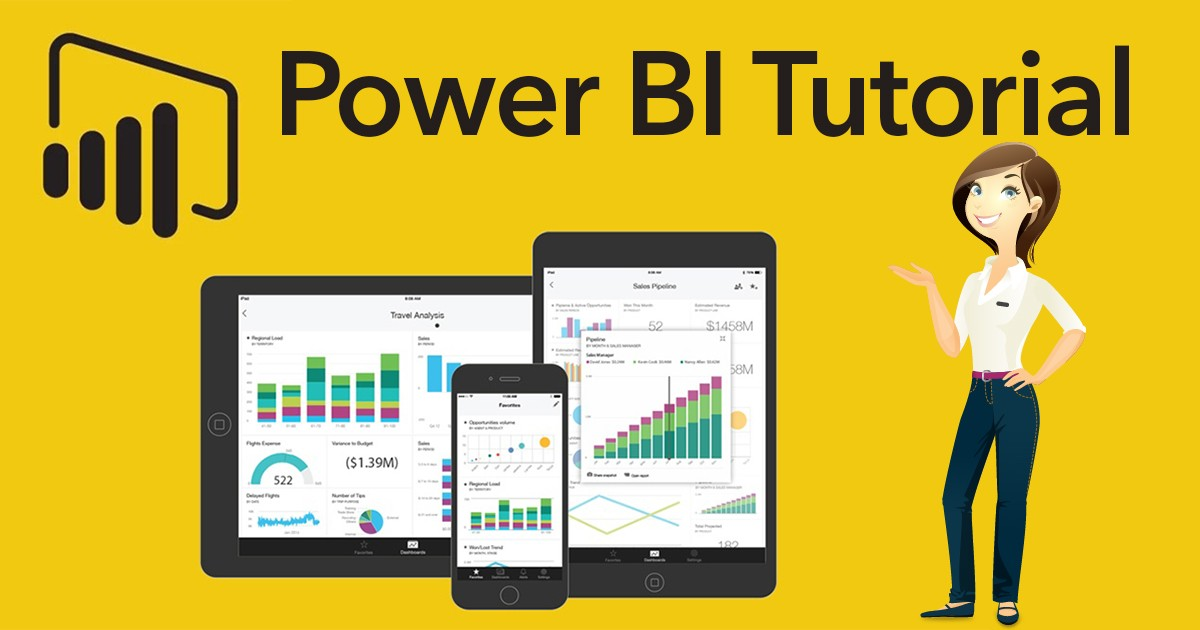
"Mastering Power BI: A Complete Guide to Data Visualization and Business Intelligence"
"Mastering Power BI: A Complete Guide to Data Visualization and Business Intelligence"
Introduction to Power BI
What is Power BI?
"Power BI is a robust business analytics solution from Microsoft that allows users to visualize data, share insights throughout their organization, and integrate interactive reports and dashboards into applications." At its core, Power BI converts raw data into meaningful information through user-friendly dashboards, reports, and visualizations.
Imagine you’re sitting on a mountain of data—spreadsheets, cloud-based sources, and more—and you want to make sense of it all. That’s where Power BI comes in. It takes that chaotic mess of data and transforms it into compelling visuals that are not just pretty to look at but are actionable. It empowers decision-makers with real-time insights, letting them steer the ship with confidence.
Whether you’re a business analyst, IT professional, or executive, Power BI offers something for everyone. "With intuitive drag-and-drop functionality and advanced AI-powered analytics, Power BI is designed for everyone—from beginners to advanced users. Best of all, you don’t need to be a data scientist to make the most of it."
In essence, Power BI acts as your data whisperer—it listens to what the numbers are saying and tells you the story they’re trying to convey. That’s why it’s become one of the leading BI tools in the market today.
Why is Power BI Important for Businesses?
"In today’s digital age, data has become one of the most valuable resources." But just having data isn’t enough—you need to refine it, analyze it, and extract insights that can drive growth and efficiency. That’s exactly what Power BI enables businesses to do.
Power BI’s importance lies in its ability to turn data into a strategic asset. Companies generate massive amounts of data every day—from customer transactions to supply chain operations. "Without the right tools, data remains an untapped resource. Power BI closes that gap by turning data into clear, accessible insights."
Let’s say you run a retail chain. With Power BI, you can track sales performance across locations, identify which products are flying off the shelves, and even forecast future demand. And it’s not just about historical data—you can tap into real-time streams and react instantly to changing conditions.
Another key benefit is its collaborative features. Power BI allows team members to share reports and dashboards, ensuring everyone is on the same page. Decision-making becomes faster, more informed, and backed by solid evidence.
Moreover, Power BI is cost-effective. You don’t need expensive infrastructure or specialized talent to get started. Its integration with Microsoft products like Excel and Azure makes it even more attractive for businesses already in the Microsoft ecosystem.
"Simply put, Power BI enables businesses to make smarter, faster decisions." And in a world where speed and accuracy matter, that’s a game-changer.
Key Features of Power BI
Data Connectivity and Integration
"A key strength of Power BI is its extensive selection of data connectors." Whether your data resides in Excel, SQL Server, Azure, Salesforce, or Google Analytics, Power BI makes it easy to connect and import that data.
Gone are the days when you had to juggle between different platforms to compile reports. With Power BI, all your data—whether it’s on-premise or in the cloud—can live in one place. "This unified perspective allows you to better analyze relationships, detect trends, and uncover anomalies."
Power BI supports both structured and unstructured data. It can connect to relational databases, big data sources, web services, and even flat files like CSVs. The built-in Power Query Editor lets you clean and shape data before using it, ensuring that your visuals are based on accurate, relevant information.
Another highlight is its seamless integration with other Microsoft tools. If you’re already using Excel, you’ll feel right at home with Power BI. It also integrates smoothly with Azure Machine Learning, SharePoint, and Microsoft Teams, enabling a truly collaborative and smart analytics environment.
In essence, Power BI’s data connectivity is like having a universal translator for your data sources—it speaks every language and brings everything into one harmonious dashboard.
Interactive Dashboards and Reports
Power BI excels at turning data into stories through visually engaging dashboards and reports. What sets it apart is the interactivity. Users can click on charts, drill down into specifics, apply filters on the fly, and see how one data point impacts another in real time.
Instead of static presentations, Power BI offers dynamic, responsive visuals that change based on user input. Want to see sales figures by region? Click the map. Curious how one product line performed over the last quarter? Tap the chart. It’s that intuitive.
Reports in Power BI are composed of multiple visualizations—bar charts, pie graphs, maps, KPIs, slicers, and more. These elements can be customized with drag-and-drop functionality, making the tool incredibly user-friendly.
And if you’re thinking this sounds like something only analysts can handle, think again. Power BI is designed for business users. Templates and built-in themes make it easy to get started, while advanced users can delve into DAX (Data Analysis Expressions) for deeper customization.
Think of Power BI dashboards as your business control room—every dial and indicator you need is right there, live and interactive.
Real-Time Data Access
In a fast-paced business environment, stale data is almost as bad as no data at all. Whether you’re monitoring social media mentions, IoT sensors, or financial transactions, Power BI can display updates as they happen.
This real-time functionality is a game-changer for industries like logistics, retail, and finance. Imagine tracking delivery trucks across a map, watching stock prices fluctuate, or analyzing customer interactions the moment they occur—all from a single dashboard.
Power BI achieves this through direct connections and APIs. Data can be pushed to dashboards via streaming datasets, Azure Stream Analytics, or PubNub. This ensures that users are always working with the latest information, leading to quicker decisions and better outcomes.
Moreover, Power BI’s alerts and notifications can keep you informed without even opening the dashboard. You can set conditions—say, if sales drop below a certain threshold—and get an email or push notification the moment it happens.
In short, real-time access in Power BI turns your data from a rear-view mirror into a live GPS—helping you navigate, not just reflect.
CONCLUSION
In conclusion, Power BI empowers organizations to transform raw data into meaningful insights with ease. Its user-friendly interface, powerful analytics, and wide range of connectivity options make it an essential tool for driving informed, data-driven decisions in today’s fast-paced business environment.


Comments
Post a Comment